Extending JSDom's HTMLElement for Jest Testing

english mobile

Tape measure extended diagonally across a barren landscape

If you're unit testing your visual JavaScript/HTML components using jsdom for DOM rendering, sooner or later you will encounter the unimplemented parts of the library. If you're not sure if you're using jsdom, check your project's package.json for "jsdom" in "dependencies" or "devDependencies". Most projects set up to use jest also use jsdom if they're testing the rendering of html elements.

I'm going to focus on extending HTMLElement, but, as the jsdom docs state, you can use these principles to fill in any functionality you're missing. I first encountered this issue while trying to implement automatic scrolling to a specific element, so let's start there. Say, for example, that your component calls scrollIntoView() on itself or a child component.

As soon as you call the method in your component that includes scrollIntoView(), you will get an error in your tests (the specific error will depend on what JavaScript framework, if any, you're using). At the very least, you need to provide an implementation of scrollIntoView() to get rid of the error. And if that's all you need, look no further than this Stack Overflow answer. In a nutshell, you add a scrollIntoView property to HTMLElement and assign a jest mock function to that property.

But what if you need to know if scrollIntoView was called from a specific HTMLElement? If you just add one function to the prototype of all HTMLElements, there's no way to know which element called it. What we need is a way to check to see if specificElement.scrollIntoView.hasBeenCalled().

The first thing we need to understand is what are the elements of our solution? The first thing is we need to figure out how to take fine-grained control of the creation of HTMLElements, and we need to do it before we create those elements. The general outline is that we have to edit the incomplete implementation of HTMLElement in jsdom to allow us to create one jest mock per element instance.

Let's start with how we're going to get Jest to load the code that augments jsdom's implementation, because there's no point in writing the code if we can't get it pulled in. Jest has a configuration option, setupFilesAfterEnv, that's designed to allow you to specify one or more files to load after the environment has booted but before any tests have run. If that option already points to a file, you can just add your code there. Otherwise, you'll need to create that file and point to it.

The next thing we need to figure out is how to add to the implementation created by jsdom in a way that lets us specify one mock scrollToTop per instance. For that, we're going to turn to good old Obect.defineProperties(), which we'll use on window.HTMLElement.prototype. The trick, though, is to figure out how to create and store the instance of the mock on each element instance.

 For that, I use a pattern I think of as "get and/or create." Object.defineProperties() lets you specify a getter function. And the nice thing about functions is that they can do things other than just getting. While normally I would say that you don't want to write a getter that has a side effect, in this case we need to leverage that, because when we define our getter we know that it will run in the scope of the instance we're trying to add to. The other thing we need is a place to store that instance so that, again, it's unique to each instance. Which is why we're using defineProperties and not defineProperty.

So the finished code looks like this:

Object.defineProperties(window.HTMLElement.prototype,
    {
        _scrollIntoView: {
            value: undefined,
            writable: true,
            configurable: true
        },
        scrollIntoView: {
            configurable: true,
            enumerable: true,
            get() {
                if (!this._scrollIntoView) this.scrollIntoView = jest.fn().mockName('scrollIntoView');
                return this._scrollIntoView;
            }
        }
    }

I hope you've found this post helpful. If so, please leave me a comment. Happy coding!

What I Learned by Being My Own Test Engineer

english mobile

The company I work for shifted focus from producing features very quickly to getting our code quality very solid to allow us to add new features without regressions. This means that it's "all hands on deck" for putting necessary tests in place to catch as many regressions as possible before we switch back into building new features.

I previously thought that it might not be worthwhile to have UI developers dive into Cucumber, Gherkin, and Selenium in Java, but this experience has opened my eyes. I've learned some things I'd been wondering about how the QA side of things works, as well as somethings I didn't know I didn't know.

QA Has a Set of Steps Written Down That They Run Through to Test

When we started writing our integration tests, one of our test engineers created a set of test cases for us to code. I'd been aware that there was a separate system used by QA, but not exactly what was in it. I belatedly realized that QA had been writing these kind of steps down all along–in that system I didn't have access to. The UI team had asked before for a set of steps to run through before submitting to QA, without success. I think the QA team had no idea we didn't have access to the system or know how to use it, and they probably wondered why we weren't using their steps. Classic miscommunication.

I also noticed how clear and precise the steps in the test case were relative to the requirements we usually get. The Project Owners I've worked with are typically focused on what they want to enable the user to do and how it should look, but there are often gaps in between. I really see the value in having the kinds of steps in a Gherkin Specification and getting sign-off before you start coding. So far, we've been writing these after the fact, but maybe in the future we can bring that forward in the process.

Some Automation Problems Are Probably Quicker and Easier to Solve if the Person Automating is Also the Developer

I've long thought that CSS in JS was one of those trends that codes around a basic lack of understanding, but it's an absolute nightmare from an automation perspective. A developer on our team had chosen to use React-Select for a search box. By default, this library only attaches dynamically-generated class names and inline styles, which makes it impossible to reliably target things like, oh, all the currently-displayed options.

Probably a test engineer would have either tried to drill down to the desired element with XPath or would have asked me to add an ID to the container inside react-select (which as far as I know is impossible). The XPath solution might have worked, but would have been extremely brittle. I would have had to say no to the impossible request. And that probably would have been the end of it for being able to test that functionality.

But since I understood the context of what was needed from the front-end developer side and I was really determined from the test engineer side, I was able to figure out how to get react-select to apply something akin to semantic class names (albeit it still feels a bit hacky and fragile based on the fact you have to concatenate the classNamePrefix you provide together with another string you can find only by inspecting an instance of the component to get the other part of the class name to use).

I'm going to add an editorial comment here that there's just no polite way to say–CSS in JS is crap. But if you're going to use it and you're developing a library you want others to use, please also provide semantic class names that can be used on their own for developers who need to integrate your component into a look and feel provided by designers who don't really have detailed understanding about how you intended customization to work. They are pretty much guaranteed to specify something you didn't imagine, that's very difficult to provide without hooks to allow developers to target the innards of your component.

Also, basic things like being able to look at the source of a page and provide an anchor link to a specific spot (like I tried to do for "classNamePrefix," in the react-select docs to use in the above paragraph) become impossible. And, circling back, semantic class names will make your code much easier to automate as well. You don't have to attach any styling of your own to the sematic class names if that bothers you. But please provide the hooks, for everyone else's sake!

Unit Tests Won't Catch Everything

I formerly had the opinion that if you practiced Test-Driven-Development on the front end and your tests covered pretty much all new functionality, that integration problems would be really obvious when you ran the code. Then you could easily see them and fix them. But I found a number of subtle bugs when writing these test cases that my unit tests hadn't caught.

For example, every test case has a requirement to check the console log for errors. This caught a call that we were making to a third-party component that's not entirely built in React that happened before that component had loaded, which threw a null pointer exception. In this case, the only side-effect was a console error, but you don't want your code that's aimed at savvy developers throwing console errors. It doesn't inspire a warm fuzzy.

In another place, I found that logic that merges the results of two API calls in different formats to generate a series of other API calls was not merging those calls correctly with realistic data, rather than our limited test data that we use while developing. That's not something my unit tests are equipped to catch.

In Summary

I'm probably not going to "quit my day job" to become a full-time QA Engineer, but I feel like pulling back the curtain some has really helped me as a developer. Even aside from the fact that thinking about things in an OO, strongly-typed way for a change has given me a fresh perspective, understanding more about how the QA sauce is made has made me way more sympathetic to the issues our test engineers face. Hopefully, I'll be able to provide more QA-friendly code in the future.

AlaSQL to search your JSON

english mobile

When you're working in JavaScript, many times you'll have a data source that is one or more JSON or JSON-like objects. When those objects are stored in an Array, you can use filter() to find the element you need, but what happens when you start to get into nested Objects—where the JSON elements in your Array themselves contain Arrays or Objects? Then you wind up with filters within filters, null checking to avoid checking properties on objects that may or may not be there, etc. Wouldn't it be nice if you could just query the objects?

With AlaSQL, you can! Note that AlaSQL can do a lot more than just querying JSON, but I'm focusing on that because that's how I'm using it at the moment. The documentation on the syntax of how to do this is written from the perspective of someone who already understands the syntax, so it doesn't really cover all the use cases I ran into. Between trawling the tests and a great deal of trial and error, I've arrived at a "layman's" understanding of how some of this works, so I thought I'd share my thoughts to make it easier for more people to use this great tool.

Here's a plunker that you can launch in a separate window to follow along:

SEARCH "/"

The forward slash just represents a "level" in the JSON Object/Array. It's especially useful when dealing with a level that's an Array, because that level won't have named properties (see example 1).

The forward slash both says where to search and what to return. So it navigates to a specific depth for both purposes (see example 2). In this example, the first "/" is the root of the Array. The second is the properties of the Objects returned, and the third says "look inside those properties." So it's the same as example 3, because categories is the only property with anything nested in it. In example 3, you can think of "categories" as being a more specific version of "/".

Returning values at a different level than where you're searching

There are two instances in which you need to return elements at a different level than you're searching: one where you need to find some ancestor element where child objects satisfy the query and one where you need to go further and get properties from the objects satisfying the query.

I'm going to start with the second first, because it's simpler. All you have to do is add the property you're looking for between the end of your entire SEARCH statement and the beginning of the FROM (esample 4). Usually that means it's going to go after WHERE (and ORDER BY, which we'll get to later), which is a little odd if you're used to database SQL, but it makes sense if you think of the result of the SEARCH as an object and then you're saying "and then I want this from the returned object."

In the case of finding an ancestor, you can kind of think of it as using a variable to say "hold that thought" at a specific level of navigation as you're drilling down, by storing that level in a variable. Then, just as you do with a property, you ask AlaSQL to return that variable from the search result (example 5).

DISTINCT, ORDER BY

DISTINCT with SEARCH is similar to DISTINCT with SELECT in regular SQL in that it wants to be right after SEARCH. It uses parentheses to enclose what should be distinct, and those should go around the entire statement that says what the SEARCH criteria are (example 6).

Like variables referring to ancestors, ORDER BY goes before FROM. It also has a special syntax for ordering by "whatever it was that the search selected." This is handy, because it can get kind of fiddly trying to figure out what the path to that should be in the ORDER BY clause. To use this syntax, just put ASC or DESC in parentheses after ORDER BY (example 7). Note that you can also just leave the parentheses empty, which is the same as ASC.

Other use cases

I'm sure I've only scratched the surface ot the SEARCH syntax, but these were a few that I ran into in my own project. I've created a plunker so that I can explore different use cases without having to wait for my Angular 2 TypeScript project to compile every time I make a change. Feel free to use it as well!

Karma Like a Boss

english mobile

For a long time, I thought you couldn't set a break point in a Jasmine test running in Karma. Heck, I even said that in a blog post. I recently learned this wasn't true. Once you know how debugging in Karma works, it seems really obvious, but I think I'm probably not alone in missing this entire feature or understanding how to make best use of it.

So let's start out by looking at a browser running Karma. When I first launched Karma with my first expect(true).toBe(true) test, I saw pretty much what everyone sees:

Of course, I clicked that honking obvious Debug button, and I got this:

Oh, thank you so much. What am I supposed to do with that? So I assumed like every end user since ever that the developer had screwed up and of course I wasn't missing something.

Meanwhile, I had the problem that all those console.log statements I kept dumping into Karma got really hard to read if it was set up to constantly rerun every time I changed a file because when I'd scroll up it was very difficult to find the beginning of any particular run. So I set Karma up to just run once and then exit so I could enter "cls" (clear screen) between runs. So the browser window closed after each run and for sure there were no break points being set.

Fast forward to the past couple of months and I've been working in Angular 2. Angular 2 and TypeScript are, in my opinion, a hot mess in terms of being able to figure out what's going on, so I've been researching hot and heavy into getting more insight when creating and running tests. So far none of that research is actually helping me with Angular 2, but when I recently worked on a coding challenge for a major software company--I am available for hire by the way--in AngularJS, all this research was pretty useful.

So let's unpick a few things that are really helpful to know:

  1. There is a reporter, karma clear screen reporter, that will clear the console at the beginning of each test run, which means you can let karma run continuously. Once you are at that point, you now have your Debug button back.
  2. When you open the Debug window, you're expected to use the browser's debug tools by pressing F12 or opening the developer tools however your favorite browser wants you to do that. At that point, you can set your break points and refresh the debug window to get access to all that debugging goodness.
  3. If you let Webstorm set up your Angular project for you, it does kind of a junit thing that by default runs karma only once every time you click the "run" button (don't use the debug button or you can't see the tree of your unit tests), but it leaves the karma browser window open. This leaves a nice clean terminal display, still gives you access to the Debug button, and shows you colorful little icons that indicate the status of your tests.

My mother like to say "the obvious, isn't." This was a lesson for me in how true this is. I hope this helps someone not go quite so long making the mistakes I did.

Multiple SVGs and CSS in AngularJS (or why SVG has to be inlined)

english mobile

In my previous post, I discussed the steps to create a SVG for use in an AngularJS project, ending with a very simple interactive SVG in Angular. In that fiddle, the SVG was completely inlined. In the case where there is only one inline SVG, it really doesn't matter if all the CSS is internal or external unless you plan to switch style sheets at runtime.

However, once you have more than one SVG, it becomes more efficient to use one style sheet for all of them. Not only that, when you use inline SVG, the SVG XML is part of the HTML DOM, so CSS styles can collide if they have the same name. As in normal CSS, the internal CSS in the SVG that is loaded latest will win in the case of a conflict. Using an external style sheet consolidates all your styles in one place so it's obvious that you're trying to call different visual styles the same thing.

Given that the CSS styles can overwrite each other (not to mention that Angular 2 is dropping support for ng-include), you might want to use one of the other methods of adding SVG to HTML, an img or object tag, so that we can take advantage of the shadow DOM. Unfortunately, AngularJS also can't reach inside the shadow DOM. This is something I realized when I started building my own example where I was going to explore techniques for styling SVG inside the shadow DOM. But since the SVG can't be made interactive with AngularJS, it kind of spoils things. Sorry for the ugly example—I'd already pulled out the CSS before I realized the SVG wasn't going to be interactive.

It's going to be interesting seeing how this plays out with Angular 2's removal of ng-include. I wonder if people will have to go to reading in the SVG XML via HTTP and hand-compiling it to get interactivity, or if Angular 2 has taken out that capability as well.

Preparing SVG for use in AngularJS

english mobile

Most developers are not also designers, but we commonly have to take a static design we get and figure out how to make it interactive. Recently, I received a set of Illustrator files that depicted circuit diagrams that a user needed to interact with to say whether they thought the circuit would have enough power to light one or more light bulbs.

I could have tried to simply create graphics with every possible state of all the bulbs, but I decided that would be difficult to maintain. I could also have tried to overlay each bulb with a div that contained the various states for that bulb, but I thought that would be difficult to make responsive. Instead, I decided to use data binding in AngularJS to allow users to interact directly with the bulbs inside the SVG.

What I found is there are a lot of resources on SVG in various places on the internet, but none pulled together all the pieces needed to accomplish this task. So I figure it’s up to me. Here are the things I needed to find out to make this work:

In this post, we'll get up and running with a simple SVG example. In the next post, we'll look at the different ways you can use SVG in HTML and the plusses and minuses of each.

How to get Illustrator to create a usable SVG file

Let’s imagine that the illustrator file I got from the designer looks something like this:
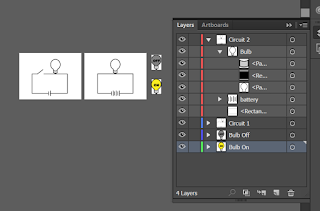
Illustrator File Structure

Because I know where I’m headed with this, the file is clean, tidy, and organized. More than likely you will have to clean up paths so they don’t have a lot of unnecessary points that will bloat your file size. You may also need to create groups and layers.

Tips: When you export files from Illustrator, each art board will be a different file. The groups and layers control how the objects are organized within that. It is possible to have objects that are in different layers that are on the same art board, and vice versa, so you may need to reorganize the files to fix that.

Avoid using underscores in layer and group names, because AI will encode them in an odd way. If you want an underscore in an object ID, use a space and Illustrator will replace it with an underscore.

At this point, you might be tempted to follow the Illustrator docs and go to File>Export>SVG. You can try, but the sad truth is there is no SVG option under File>Export in Illustrator CC. Instead, you can go to File>Save As. You’ll want to select “Use ArtBoards.”
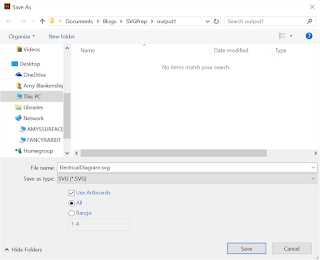
Save As dialog

Once you click “Save”, it doesn’t save—Hey-ho, counterintuitive dialog! Instead, it will take you to another dialog, where you can select your SVG output options. The defaults are pretty good. Note here that we’ve selected “Style Attributes” for our CSS Properties. What that means is that things like stroke and fill color will be turned into CSS styles in a style tag at the top of the document. For more on the other options, see Demystifying Adobe Illustrator's Advanced Options for SVG Work.
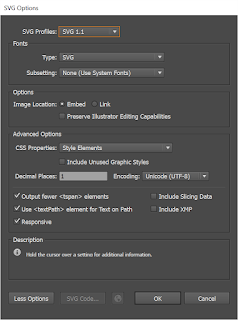
SVG Save Options

Once you click “OK,” you’ll get an SVG file for every artboard. If you open one of these in any XML or text editor, you’ll get something (output1) like this:

<?xml version="1.0" encoding="utf-8"?>
<!-- Generator: Adobe Illustrator 18.1.0, SVG Export Plug-In . SVG Version: 6.00 Build 0) -->
<svg version="1.1" xmlns="http://www.w3.org/2000/svg" xmlns:xlink="http://www.w3.org/1999/xlink" x="0px" y="0px"
viewBox="0 0 400 300" style="enable-background:new 0 0 400 300;" xml:space="preserve">
<style type="text/css">
.st0{fill:#FCEE21;stroke:#000000;stroke-width:3;stroke-miterlimit:10;}
.st1{stroke:#000000;stroke-width:3;stroke-miterlimit:10;}
.st2{fill:#CCCCCC;stroke:#000000;stroke-width:2;stroke-miterlimit:10;}
.st3{fill:#808080;stroke:#000000;stroke-width:3;stroke-miterlimit:10;}
.st4{fill:#FFFFFF;stroke:#000000;stroke-width:3;stroke-miterlimit:10;}
.st5{fill:#FFFFFF;}
.st6{fill:none;stroke:#000000;stroke-width:3;stroke-miterlimit:10;}
</style>
<g id="Bulb_On">
</g>
<g id="Bulb_Off">
</g>
<g id="Circuit_1">
<polyline class="st4" points="158.3,137.1 311.3,137.1 311.3,261.2 83.3,261.2 83.3,137.1 117.4,137.1 154.4,108.1 "/>
<g id="battery">
<rect x="188.5" y="258" class="st5" width="15.1" height="6"/>
<line class="st6" x1="190.5" y1="250" x2="190.5" y2="274"/>
<line class="st6" x1="201.5" y1="244" x2="201.5" y2="278"/>
</g>
<g id="Bulb_1_">
<path class="st4" d="M264.9,76.3c0-18.6-13.9-33.6-31-33.6c-17.1,0-30.8,15.1-30.8,33.6c0,13.7,7.5,25.4,18.5,30.7v21.6h25v-21.6
C257.5,101.7,264.9,89.9,264.9,76.3z"/>
<rect x="230.5" y="131.3" class="st1" width="6.8" height="5.6"/>
<path class="st2" d="M246.6,129.6c-2.6,1-6.6,2.3-11.7,2.4c-6.1,0.2-10.9-1.3-13.7-2.4c0-5.9,0-11.8,0-17.7
c2.1,1.1,6.6,3.3,12.8,3.3c6.1,0,10.5-2.1,12.6-3.3C246.6,117.8,246.6,123.7,246.6,129.6z"/>
</g>
</g>
<g id="Circuit_2">
</g>
</svg>

I don't know about you, but I'd like some more informative style names. So, back in the Illustrator file, we'll create and apply some named styles, like so:
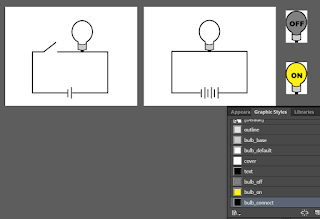
Illustrator file with named styles applied

Once you do that, your SVG should look more like this:

  • <?xml version="1.0" encoding="utf-8"?>
    <!-- Generator: Adobe Illustrator 18.1.0, SVG Export Plug-In . SVG Version: 6.00 Build 0) -->
    <svg version="1.1" xmlns="http://www.w3.org/2000/svg" xmlns:xlink="http://www.w3.org/1999/xlink" x="0px" y="0px"
    viewBox="0 0 400 300" style="enable-background:new 0 0 400 300;" xml:space="preserve">
    <style type="text/css">
    .outline{fill:none;stroke:#000000;stroke-width:3;stroke-miterlimit:10;}
    .bulb_base{fill:#CCCCCC;stroke:#000000;stroke-width:2;stroke-miterlimit:10;}
    .bulb_default{fill:#FFFFFF;stroke:#000000;stroke-width:3;stroke-miterlimit:10;}
    .cover{fill:#FFFFFF;}
    .bulb_connect{stroke:#000000;stroke-width:3;stroke-miterlimit:10;}
    .st0{fill:#FCEE21;stroke:#000000;stroke-width:3;stroke-miterlimit:10;}
    .st1{fill:#808080;stroke:#000000;stroke-width:3;stroke-miterlimit:10;}
    </style>
    <g id="Bulb_On">
    </g>
    <g id="Bulb_Off">
    </g>
    <g id="Circuit_1">
    <polyline class="outline" points="158.3,137.1 311.3,137.1 311.3,261.2 83.3,261.2 83.3,137.1 117.4,137.1 154.4,108.1 "/>
    <g id="battery">
    <rect x="188.5" y="258" class="cover" width="15.1" height="6"/>
    <line class="outline" x1="190.5" y1="250" x2="190.5" y2="274"/>
    <line class="outline" x1="201.5" y1="244" x2="201.5" y2="278"/>
    </g>
    <g id="Bulb_1_">
    <path class="bulb_default" d="M264.9,76.3c0-18.6-13.9-33.6-31-33.6c-17.1,0-30.8,15.1-30.8,33.6c0,13.7,7.5,25.4,18.5,30.7v21.6
    h25v-21.6C257.5,101.7,264.9,89.9,264.9,76.3z"/>
    <rect x="230.5" y="131.3" class="bulb_connect" width="6.8" height="5.6"/>
    <path class="bulb_base" d="M246.6,129.6c-2.6,1-6.6,2.3-11.7,2.4c-6.1,0.2-10.9-1.3-13.7-2.4c0-5.9,0-11.8,0-17.7
    c2.1,1.1,6.6,3.3,12.8,3.3c6.1,0,10.5-2.1,12.6-3.3C246.6,117.8,246.6,123.7,246.6,129.6z"/>
    </g>
    </g>
    <g id="Circuit_2">
    </g>
    </svg>

Hand-editing the files

This file is in much better shape. It has some extra things you'll need to remove, but all of that is obvious. First, you need to remove the comment. After that, you can remove the styles that are in the form .stx (where x is some number). Those are the styles that are not used by the graphics that were on the artboard that became this particular document. Then you need to remove the empty "g" tags that, again, represent the other art boards.

We're only going to use the two circuit diagrams in Angular, but we need to combine the two bulbs into one "g" tag and replace the existing bulb in each circuit diagram with it. One of the goals is to have a "g" where all the graphics are relative to the zero point so we can just translate it to where the empty bulb is in the circuit diagram. This is because the syntax of the path objects doesn't lend itself to easily being moved around in the SVG file, so it's easier to create the objects at the zero point and move the entire group they are in. Unfortunately, we can't just use the bulbs output as SVG because they didn't respect the artboard bounds used in the document. So we're going to go back to Illustrator and create a new file with all the needed shapes by copying and pasting pieces from our existing file.
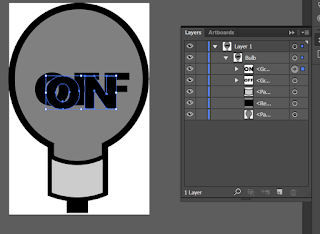
Bulb with both on and off text in Illustrator

If you simply copy all the contents of this document to your clipboard, your clipboard will contain something like this:

<!-- Generator: Adobe Illustrator 18.1.0, SVG Export Plug-In  -->
<svg version="1.1"
xmlns="http://www.w3.org/2000/svg" xmlns:xlink="http://www.w3.org/1999/xlink" xmlns:a="http://ns.adobe.com/AdobeSVGViewerExtensions/3.0/"
x="0px" y="0px" width="65px" height="97.2px" viewBox="0 0 65 97.2" style="overflow:scroll;enable-background:new 0 0 65 97.2;"
xml:space="preserve">
<style type="text/css">
.bulb_base{fill:#CCCCCC;stroke:#000000;stroke-width:2;stroke-miterlimit:10;}
.bulb_connect{stroke:#000000;stroke-width:3;stroke-miterlimit:10;}
.bulb_off{fill:#808080;stroke:#000000;stroke-width:3;stroke-miterlimit:10;}
</style>
<defs>
</defs>
<g id="Bulb_1_">
<path class="bulb_off" d="M63.5,35.1c0-18.6-13.6-33.6-30.8-33.6C15.6,1.5,1.5,16.6,1.5,35.1c0,13.7,7.1,25.4,18.1,30.7v21.6h25
V65.8C55.6,60.5,63.5,48.8,63.5,35.1z"/>
<rect x="28.4" y="90.1" class="bulb_connect" width="6.8" height="5.6"/>
<path class="bulb_base" d="M44.6,88.4c-2.6,1-6.6,2.3-11.7,2.4c-6.1,0.2-10.9-1.3-13.7-2.4c0-5.9,0-11.8,0-17.7
C21.2,71.9,25.8,74,32,74c6.1,0,10.5-2.1,12.6-3.3C44.6,76.6,44.6,82.5,44.6,88.4z"/>
<g id="Off_text_1_">
<path class="text" d="M12.3,39.9c0-9.9,15.1-10.5,15.6-0.6c0.2,4.9-2.7,8.3-7.6,8.3C15.5,47.6,12.3,44.6,12.3,39.9z M17,39.9
c0,2.1,0.7,4.2,3.1,4.3c2.6,0,3.2-2.4,3.1-4.5C23.2,34.4,17,34.6,17,39.9z"/>
<path class="text" d="M30.4,32.3h11.5v3.2h-6.8v2.6h5.8v3h-5.8v6.1h-4.7V32.3z"/>
<path class="text" d="M44.4,32.3h11.5v3.2h-6.8v2.6h5.8v3h-5.8v6.1h-4.7V32.3z"/>
</g>
<g id="On_text_1_">
<path class="text" d="M17.3,41.4c0-9.9,15.1-10.5,15.6-0.6c0.2,4.9-2.7,8.3-7.6,8.3C20.5,49.2,17.3,46.2,17.3,41.4z M22,41.5
c0,2.1,0.7,4.2,3.1,4.3c2.6,0,3.2-2.4,3.1-4.5C28.2,36,22,36.2,22,41.5z"/>
<path class="text" d="M35.4,33.9h4.3l5.7,8.3v-8.3h4.4v15h-4.4l-5.6-8.3V49h-4.4V33.9z"/>
</g>
</g>
</svg>

Note that if you copy a selection that contains actual text, you will not get SVG on your clipboard. Instead, you'll just get the text.

The part we want is the "g" with the id of "Bulb_1." I'm going to clean up and rename some things to remove the unnecessary numbers Illustrator is putting at the end of many of our g id's. I'll also change the path that has a class of "bulb_off" to have no class, but instead to have an id of "bulb_bg." We'll be changing the fill of this path and the visibility of the "off" and "on" text based on whether the bulb is on or off. We'll wind up with this:

<g id="Bulb">
<path id="bulb_bg" d="M63.5,35.1c0-18.6-13.6-33.6-30.8-33.6C15.6,1.5,1.5,16.6,1.5,35.1c0,13.7,7.1,25.4,18.1,30.7v21.6h25
V65.8C55.6,60.5,63.5,48.8,63.5,35.1z"/>
<rect x="28.4" y="90.1" class="bulb_connect" width="6.8" height="5.6"/>
<path class="bulb_base" d="M44.6,88.4c-2.6,1-6.6,2.3-11.7,2.4c-6.1,0.2-10.9-1.3-13.7-2.4c0-5.9,0-11.8,0-17.7
C21.2,71.9,25.8,74,32,74c6.1,0,10.5-2.1,12.6-3.3C44.6,76.6,44.6,82.5,44.6,88.4z"/>
<g id="Off_text">
<path class="text" d="M12.3,39.9c0-9.9,15.1-10.5,15.6-0.6c0.2,4.9-2.7,8.3-7.6,8.3C15.5,47.6,12.3,44.6,12.3,39.9z M17,39.9
c0,2.1,0.7,4.2,3.1,4.3c2.6,0,3.2-2.4,3.1-4.5C23.2,34.4,17,34.6,17,39.9z"/>
<path class="text" d="M30.4,32.3h11.5v3.2h-6.8v2.6h5.8v3h-5.8v6.1h-4.7V32.3z"/>
<path class="text" d="M44.4,32.3h11.5v3.2h-6.8v2.6h5.8v3h-5.8v6.1h-4.7V32.3z"/>
</g>
<g id="On_text>
<path class="text" d="M17.3,41.4c0-9.9,15.1-10.5,15.6-0.6c0.2,4.9-2.7,8.3-7.6,8.3C20.5,49.2,17.3,46.2,17.3,41.4z M22,41.5
c0,2.1,0.7,4.2,3.1,4.3c2.6,0,3.2-2.4,3.1-4.5C28.2,36,22,36.2,22,41.5z"/>
<path class="text" d="M35.4,33.9h4.3l5.7,8.3v-8.3h4.4v15h-4.4l-5.6-8.3V49h-4.4V33.9z"/>
</g>
</g>

Next, we'll go back into one of our circuit svg files and replace the plain bulb with this bulb, translated to where the original bulb was. I usually look in illustrator at the properties or transform panel in the original file to see where it was.

The edited svg looks like this:

<?xml version="1.0" encoding="utf-8"?>
<svg version="1.1" xmlns="http://www.w3.org/2000/svg" xmlns:xlink="http://www.w3.org/1999/xlink" x="0px" y="0px"
viewBox="0 0 400 300" style="enable-background:new 0 0 400 300;" xml:space="preserve">
<style type="text/css">
.outline{fill:none;stroke:#000000;stroke-width:3;stroke-miterlimit:10;}
.bulb_base{fill:#CCCCCC;stroke:#000000;stroke-width:2;stroke-miterlimit:10;}
.bulb_default{fill:#FFFFFF;stroke:#000000;stroke-width:3;stroke-miterlimit:10;}
.cover{fill:#FFFFFF;}
.bulb_connect{stroke:#000000;stroke-width:3;stroke-miterlimit:10;}
</style>
<g id="Circuit_1">
<polyline class="outline" points="158.3,137.1 311.3,137.1 311.3,261.2 83.3,261.2 83.3,137.1 117.4,137.1 154.4,108.1 "/>
<g id="battery">
<rect x="188.5" y="258" class="cover" width="15.1" height="6"/>
<line class="outline" x1="190.5" y1="250" x2="190.5" y2="274"/>
<line class="outline" x1="201.5" y1="244" x2="201.5" y2="278"/>
</g>
<g id="Bulb" transform="translate(201, 41)">
<path id="bulb_bg" d="M63.5,35.1c0-18.6-13.6-33.6-30.8-33.6C15.6,1.5,1.5,16.6,1.5,35.1c0,13.7,7.1,25.4,18.1,30.7v21.6h25
V65.8C55.6,60.5,63.5,48.8,63.5,35.1z"/>
<rect x="28.4" y="90.1" class="bulb_connect" width="6.8" height="5.6"/>
<path class="bulb_base" d="M44.6,88.4c-2.6,1-6.6,2.3-11.7,2.4c-6.1,0.2-10.9-1.3-13.7-2.4c0-5.9,0-11.8,0-17.7
C21.2,71.9,25.8,74,32,74c6.1,0,10.5-2.1,12.6-3.3C44.6,76.6,44.6,82.5,44.6,88.4z"/>
<g id="Off_text">
<path class="text" d="M12.3,39.9c0-9.9,15.1-10.5,15.6-0.6c0.2,4.9-2.7,8.3-7.6,8.3C15.5,47.6,12.3,44.6,12.3,39.9z M17,39.9
c0,2.1,0.7,4.2,3.1,4.3c2.6,0,3.2-2.4,3.1-4.5C23.2,34.4,17,34.6,17,39.9z"/>
<path class="text" d="M30.4,32.3h11.5v3.2h-6.8v2.6h5.8v3h-5.8v6.1h-4.7V32.3z"/>
<path class="text" d="M44.4,32.3h11.5v3.2h-6.8v2.6h5.8v3h-5.8v6.1h-4.7V32.3z"/>
</g>
<g id="On_text>
<path class="text" d="M17.3,41.4c0-9.9,15.1-10.5,15.6-0.6c0.2,4.9-2.7,8.3-7.6,8.3C20.5,49.2,17.3,46.2,17.3,41.4z M22,41.5
c0,2.1,0.7,4.2,3.1,4.3c2.6,0,3.2-2.4,3.1-4.5C28.2,36,22,36.2,22,41.5z"/>
<path class="text" d="M35.4,33.9h4.3l5.7,8.3v-8.3h4.4v15h-4.4l-5.6-8.3V49h-4.4V33.9z"/>
</g>
</g>
</g>
</svg>

If you preview the SVG in a browser, it looks like this, because we haven't defined the on and off classes or applied them:
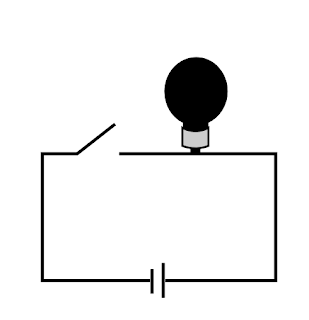
Circuit diagram with black bulb

We'll add the styles for the bulb based on the named styles in our exported svg with the on and off bulbs in them. I usually hard-code the class for each state just to make sure they look the way I expect. This is the code for the "on" state:

<?xml version="1.0" encoding="utf-8"?>
<svg version="1.1" xmlns="http://www.w3.org/2000/svg" xmlns:xlink="http://www.w3.org/1999/xlink" x="0px" y="0px"
viewBox="0 0 400 300" style="enable-background:new 0 0 400 300;" xml:space="preserve">
<style type="text/css">
.outline{fill:none;stroke:#000000;stroke-width:3;stroke-miterlimit:10;}
.bulb_base{fill:#CCCCCC;stroke:#000000;stroke-width:2;stroke-miterlimit:10;}
#bulb_bg{fill:#FFFFFF;stroke:#000000;stroke-width:3;stroke-miterlimit:10;}
#On_text, #Off_text {visibility:hidden}
.cover{fill:#FFFFFF;}
.bulb_connect{stroke:#000000;stroke-width:3;stroke-miterlimit:10;}
.off #bulb_bg {fill:#808080;stroke:#000000;stroke-width:3;stroke-miterlimit:10;}
.on #On_text, .off #Off_text {visibility:visible}
.on #bulb_bg {fill:#FCEE21;stroke:#000000;stroke-width:3;stroke-miterlimit:10;}
</style>
<g id="Circuit_1">
<polyline class="outline" points="158.3,137.1 311.3,137.1 311.3,261.2 83.3,261.2 83.3,137.1 117.4,137.1 154.4,108.1 "/>
<g id="battery">
<rect x="188.5" y="258" class="cover" width="15.1" height="6"/>
<line class="outline" x1="190.5" y1="250" x2="190.5" y2="274"/>
<line class="outline" x1="201.5" y1="244" x2="201.5" y2="278"/>
</g>
<g id="Bulb" class="on" transform="translate(201, 41)">
<path id="bulb_bg" d="M63.5,35.1c0-18.6-13.6-33.6-30.8-33.6C15.6,1.5,1.5,16.6,1.5,35.1c0,13.7,7.1,25.4,18.1,30.7v21.6h25
V65.8C55.6,60.5,63.5,48.8,63.5,35.1z" />
<rect x="28.4" y="90.1" class="bulb_connect" width="6.8" height="5.6"/>
<path class="bulb_base" d="M44.6,88.4c-2.6,1-6.6,2.3-11.7,2.4c-6.1,0.2-10.9-1.3-13.7-2.4c0-5.9,0-11.8,0-17.7
C21.2,71.9,25.8,74,32,74c6.1,0,10.5-2.1,12.6-3.3C44.6,76.6,44.6,82.5,44.6,88.4z"/>
<g id="Off_text">
<path class="text" d="M12.3,39.9c0-9.9,15.1-10.5,15.6-0.6c0.2,4.9-2.7,8.3-7.6,8.3C15.5,47.6,12.3,44.6,12.3,39.9z M17,39.9
c0,2.1,0.7,4.2,3.1,4.3c2.6,0,3.2-2.4,3.1-4.5C23.2,34.4,17,34.6,17,39.9z"/>
<path class="text" d="M30.4,32.3h11.5v3.2h-6.8v2.6h5.8v3h-5.8v6.1h-4.7V32.3z"/>
<path class="text" d="M44.4,32.3h11.5v3.2h-6.8v2.6h5.8v3h-5.8v6.1h-4.7V32.3z"/>
</g>
<g id="On_text">
<path class="text" d="M17.3,41.4c0-9.9,15.1-10.5,15.6-0.6c0.2,4.9-2.7,8.3-7.6,8.3C20.5,49.2,17.3,46.2,17.3,41.4z M22,41.5
c0,2.1,0.7,4.2,3.1,4.3c2.6,0,3.2-2.4,3.1-4.5C28.2,36,22,36.2,22,41.5z"/>
<path class="text" d="M35.4,33.9h4.3l5.7,8.3v-8.3h4.4v15h-4.4l-5.6-8.3V49h-4.4V33.9z"/>
</g>
</g>
</g>
</svg>

It looks like this in the browser:
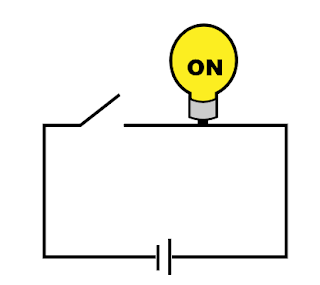
Circuit with bulb on

Now that we know all our styles look right, we're going to edit the Bulb group to be interactive:

<g id="Bulb" data-ng-class="bulb.state" data-ng-click="toggleBulbState()" transform="translate(201, 41)">
...
</g>

A Simple AngularJS Project with Interactive SVG

Spying on AngularJS Services That Are called Directly as Functions

english mobile

Jasmine spies are great. But when testing AngularJS services, it can really be be hard to test that the correct calls are being made to services where you’re calling the service itself instead of an attached method, such as the $interval service. When you’re testing controllers, you can directly inject your own spy if you want to test that $interval was called with the correct arguments, but how do you get hold of a function that’s not attached to an object to be able to spy on it?
It turns out that your only option is to replace the service with your spy in the config phase with either $provide.decorator, or module.decorator. For your TL;DR convenience, here is a working module that you can add to the list of modules you instantiate before each test. I’ll explain why all this works after the code.

angular.module('spies.interval', [])
    .decorator('$interval', function($delegate){
       var spy = jasmine.createSpy(‘$interval’).and.callFake(
           function()  {
               return  $delegate.apply(arguments);
           }
       )
       spy.cancel =  angular.bind($delegate, $delegate.cancel);
       spy.flush =  angular.bind($delegate, $delegate.flush);
       spyOn(spy,  'cancel').and.callThrough();
       return spy;
    })

The spy game

Let’s first think about what happens when you call spyOn(someObj, ‘someFunction’), so we can understand why we’re not using that syntax here. Jasmine looks at someObj. If someObj has a function called ‘someFunction’, jasmine overwrites that function with a generic spy which may or may not call the original someFunction. But without someObj, there is nothing to attach that replacement function to to make the replacement invisible to the calling code under test.

Knowing when to delegate

So we have to “trick” Angular into injecting our replacement into the code under test when the code asks for the $interval service. We do this by returning the actual spy rather than an altered $delegate.
This then becomes very different from injecting a fake $interval service into a controller that’s created for just one test, because when you call $interval(), it caches the method to call after the elapsed time, the elapsed time, and so forth internally so that it can work its magic. So if you only replace $interval with a spy, you can no longer test that the right things happen after the time has elapsed, because that internal state isn’t right.
So we need to go on to call the actual $interval service, and we need to call it with the arguments that our service under test is using, which is why we use apply(). Once we’ve done that, we need to make sure to return the result of the call, a promise, so that when we test that code that should be canceled in our client code does not run, that doesn’t break because there’s no promise to give cancel().
Once you’ve taken all of the above into account, you have
var spy = jasmine.createSpy(‘$interval’).and.callFake(
    function() {
        return $delegate.apply(arguments);
})

Spies upon spies

 But you can’t call cancel yet (or flush), because the spy you’re replacing $interval with doesn’t have a cancel() method or a flush() method. If you try just directly adding the functions (spy.cancel = $delegate.cancel), the functions don’t run in the same scope that we wrote to when we called $delegate.apply().  By using angular.bind, we force them into the same scope as the delegate like so:
spy.cancel = angular.bind($delegate, $delegate.cancel);
spy.flush = angular.bind($delegate, $delegate.flush);
Finally, we spy on the cancel function. This is just a convenience—you can of course spy on this function as normal from any test.
spyOn(spy, 'cancel').and.callThrough();
And that, folks, is how you create a spy to be able to check that an angular service where the function is called directly was called with the correct methods without breaking the service.

But wait, there’s more

If you’re a Jasmine expert, you’re probably thinking that I could have just used the undocumented second argument of createSpy, which simplifies the code to this:
angular.module('spies.interval', [])
     .decorator('$interval', function($delegate){
        var spy =  jasmine.createSpy('$interval', $delegate);
        spyOn(spy,  'cancel').and.callThrough();
        return spy;    
})
Unfortunately, that doesn’t work. You would expect the Strategy to do the same thing internally that my home-rolled version does, but it doesn’t. Maybe some other day I’ll dig through the code and blog about why.

How useful is this anyway?

I think the main reason to use this is when the amount of time you need to wait or the optional arguments at the end will vary based on some data. However, your test usually can’t even see the method that ultimately gets called by $interval. So it feels a bit like it should not need to know so much about it that it is looking at what arguments are being passed to this function it can’t see.
So after all this, I ultimately came to feel that though you can do this, you probably shouldn’t, because it introduces a lot of coupling between your test and the internals of the methods in your service that you’re trying to test. For example, your test should not need to know whether your service internally creates its own closure to store state to call the method from in $interval or whether it directly stores that state in the end parameters of $interval.
In Scotland, they have a saying that a gentleman is a man who knows how to play the bagpipes, but doesn’t. I often feel that programming is like that.

Tips for Testing AngularJS SPA's with Karma and Jasmine

english mobile

When I first started unit testing with AngularJS, Karma, and Jasmine, I read everything I could get my hands on about the subject. While there’s a lot of good material out there, I wouldn’t want to write tests, let alone ask my team to do so based on the material I originally found. This post is the one I wish I’d found when I first started writing tests, less of a “just how to get it working” and more of a “how to make writing tests a sustainable part of your process.” Some of these tips seem relatively trivial, but even little things can add up to make writing tests easier for a team.

Angular.mock.dump() and karma.dump()

One thing that is hard about unit testing with Karma is it’s not that practical to set break points. When I first started doing unit testing, I didn’t even know that you could use console.log() to print out useful messages from the tests and code.

When I figured that out, it helped quite a bit. However, complex objects could get hard to read and sometimes even would be truncated. It turns out that angular.mock has a method, dump() that will format the object to be legible from the command prompt window. Karma also has a dump() function that’s basically a shortcut to console.log().

Setting flags to only print information from certain tests

One thing that’s a little scary about using angular.mock.dump() in the code under test is that you’re going to get an error when you try to run that code and it’s not from a test. In addition, if a lot of tests run a particular piece of code, it can be difficult finding the output that matters to the test you’re working on from a firehose of output statements.

I like to give my AngularJS “classes” a method that sets a flag to turn these statements on and off. I usually call it setDebug(), and then I will call that from the test I’m currently working on (or in a beforeEach, depending on how early I need it set).

Shared Data Sources

It’s pretty common for multiple Services and Controllers to need similar data sets in their tests, so the data sets are easier to use and maintain if they are not kept in each spec, which is what you’ll see in most test examples on the internet. The biggest thing that has made testing sustainable for my team is to develop a convention for our data sources, both in how they’re named and how they’re structured.

The service name will usually be “myDataTypeData”. In turn, the mocks that are mocking services that retrieve those data sets can be given a path of “myDataType” and will return the data from the myDataTypeData service by asking for it from the injector.

Each data service has a method, “getAllData,” that returns converted json from an entire XML file, including a collection of data items with some header information that pertains to the collection as a whole. It also has a “getNormalizedDataItems” method that returns the collection of data items pre-processed to remove the XML artifacts. So tests that are testing large pieces of the application and tests that are testing smaller pieces of the application can get the data they need.

Balancing DAMP with DRY

Most of us have heard of DRY (Don’t Repeat Yourself) for production code, which means that rather than duplicating code to other places that need similar functionality, you extract that code and call it from all the different places that need it. Unit tests often are running almost the same code, but with slightly different inputs. One of the purposes of tests is to document what the software should do, so developers need to be able to see at a glance what the inputs are, where they are going, and what the expected outputs are. So tests are often written to be DAMP (Descriptive and Meaningful Phrases), which can translate to a lot of repeated code.

If you’ve ever wanted to make a major change in your code and felt that sinking feeling because you knew that too many places referenced it directly, you understand why DRY is a good thing. Change things in one place and you’re done. It can be hard to make a business case for tests to non-technical managers, so the last thing you ever want to say is “yes, we can make that change but it will take a while because there are a lot of tests around that functionality.”

After being bitten by that one, I developed a strategy that works in part because of my shared data sources. Most Jasmine specs have a setup() method. The first argument will usually be the data source name. If we’re testing at the individual data item level, the second argument will be the index of the data item I want.

Here’s where it gets tricky, because the setup step is usually going to instantiate something, whether it’s $controller building a controller for me to test with the data item attached to its $scope or a Factory (not an angular factory, specifically, but the Factory pattern) that is responsible for turning that data item into something else. So customization often needs to happen in between when we retrieve the data from the service and when we construct the item.

To handle that, I use a third parameter that takes a function to perform whatever extra massaging I need to customize the data before the actual object gets made. This means that once you know the pattern, you can read setup(‘someType’, 2, function (dataItem) dataItem.foo=’bar’}), and know exactly what is going on. In most cases, it’s not critical to see all the steps to retrieve the data and make the thing, with all the $rootScope.apply() calls that keep angular happy. What you care about is what’s special about this data as an input.

The flip side of that is that most examples you’ll see on blogs, etc., have a beforeEach() method at the top of the spec that pulls absolutely everything you’ll need from the $injector and stores it in a variable. This can get kind of hard to read, especially if for whatever reason you don’t use the actual name of the service as the variable name. And of course there’s that little part of my developer soul that is slightly bothered by exposing a variable for an entire spec that is only used in one place.

It took me a while to realize it, but you can use inject() any place that takes a Function in a spec. So, you can put an inject() in any beforeEach, not just the first one, or as the second parameter for a describe() or it() statement. Probably the only thing stopping you from injecting at the top-level describe block and simplifying your variable declarations is the need to bootstrap the module(s) under test.

Modularization

When I took over the project I am currently leading, it was basically a prototype grown out of control. It had no tests and few modules. Our first priority was to start writing tests on new code, and then we started breaking out modules based on features. But our tests all bootstrapped the full app. The tests began to take longer and longer to run, so we knew that had to stop. Our first efforts at just bootstrapping a few modules in tests broke the tests pretty hard, so we put that task on the back burner while we continued to think about it.

Finally, it occurred to me that we had made a bad assumption when we decided what to leave in the main “app” module. It seemed logical at the time to leave pieces that were used in a lot of places in the app in the app itself. That was exactly backward, because any test that tested anything that depended on any of these commonly-used services had to bootstrap the app, which bootstraps everything. So the lesson learned there is “the more places it’s used, the more it needs to be in its own module.”

We also added a “mocks” module, which contains overrides of some of the services that we don’t want to really use in tests (like the one that plays audio or the one that reads the XML into JSON). By doing it this way, we can choose the real service simply by not bootstrapping “mocks.” The exception to this is sometimes you have to bootstrap the module the service is actually in, and that module can “win.” To resolve that situation, you can register a mock service in the module where the original service was, which will overwrite it, and also register it in the mocks module.

What are your tips?

I by no means claim that these tips and tricks are the best way to do things, but they are things I have found out for myself through trial and error that I have found helpful. Maybe you’ll find them helpful. If you have some killer ways to rock your jasmine tests, please feel free to share them in the comments.

How I learned to stop hating the command line (so much)

english mobile

I'm old. So I still remember when every computer screen looked like what we now call "the command line." Screens were black and text was green or amber. Anything you needed to do on the computer took forever and depended on your ability to remember lots of commands and type them correctly. This made computing seem difficult and unapproachable. So when the first MacIntosh computers showed up in the Art Department where I was studying, I was as happy as anyone.

Finally, it was (more or less) obvious how the computer was organized, and figuring out how to do things and what you could do was easy and intuitive. When I first used a Windows 3.1 computer, I was even more delighted. And so I have been a relatively happy camper for many years. Of course there have been difficulties and frustrations, but by and large if there was any task worth doing someone had built an interface that made it easy to do things without having to remember tedious commands and type them accurately. This allowed me to reserve my head space for the problems that actually interested me and/or I had been hired to solve.

I recently started learning AngularJS, and I was dismayed to find that before you can even start with Angular, you have to do a fair amount of work in the command line. Not only that, but there's little explanation of why you need to do these steps and no explanation of whether there are alternate routes to accomplish the same thing. I get that when you're trying to write a tutorial if you try to cover every last bit of background information someone might want to know that you'd never get finished.

However, the absence of such supporting information right now means that if you want to learn AngularJS (and I suspect many other current JavaScript frameworks) you're stuck using the command line whether you like it or not. You may not be surprised to learn that I don't especially like it. I've learned a few things over the past couple of months that make me dislike it a lot less. So if you share my dislike of the command line, keep reading and maybe we can make life a little easier.

Why we need the command line

As my elementary school teachers could tell you, I've never been especially fond of just doing things without knowing why. So let's start with why it is that it seems everything needs to go through the command line. The answer is simple (but seldom articulated): nodejs. Node was designed as a server-side technology, so the only facility it has for drawing to the screen is a browser that's pointed to a site that it's serving. However, most of the tools you use during JS development aren't conceived that way and I have no idea if they could be.

You get a few things from node that nearly make its lack of a decent UI worth it.

  1. Node lets you run a webserver (or several) out of any directory on your computer. Unlike more traditional web servers such as IIS or Apache, Node lets you just fire up a server anywhere. Security considerations aside, it's pretty cool that you're now free to put your code in whatever directory makes sense for development rather than the directory that the web server can see (or that you've set up as a virtual directory). You can even have one server running the site and another server running the unit tests.
  2. Node Package Manager (npm). Npm is like a magic registry in the sky that will allow you to more or less instantly download and install most tools and libraries you'll need for doing Javascript development. It will also make sure that if those tools have dependencies that the libraries they depend on are also installed, even if the different tools depend on different versions of the same library.
  3. Many of the tools are also in node or at least depend on it/run on top of it. For example, Karma test runner launches a node server on its own port to run the tests.

So we kind of have to use it, or at least get enough benefit from it that we can grit our teeth and use the command line. I had several pain points that were driving me flat up the wall, so I'd like to share some solutions that made things easier for me.

Navigating to directories

Directories to me are only significant as a way to keep things organized and insofar as they affect whether my code runs properly or not. It's not even on my radar to be interested in constantly typing (correctly, no less) CD and the full path to the directory where my code lives. So yes, I know from a stint doing embedded development on a Linux device a few years ago that to some extent you can get the CLI to type paths for you by typing the first letter or two of each directory and pressing the tab key. But that's only slightly less tedious. After several days of this, I got really annoyed and went searching.

What I found is that on Windows you can hold down the shift key while right-clicking on a folder. This adds "Open a command prompt here" to the context menu. Note that this is in a different spot on the context menu depending if you right-click on the left pane (shown) or the right pane.

Mac/Linux people, I am sure Google can tell you similar shortcuts for your environment. The point is you don't have to type the path over and over.

Typing the same crap over and over

If I enjoyed typing the same crap over and over, I probably wouldn't have decided to be a programmer. But as I got into the red-green rhythm of testing, I found myself typing karma start (red), karma start (green), cls (if the test passed, clear the screen and on to the next test).

Again, my vague memories came to the rescue and I remembered that you can use your up and down arrow keys to rerun the same commands again. So, once I'd typed karma start once, I could run it again by pressing the up arrow key once and pressing Enter. Then, after typing cls, two up arrows goes back past cls to karma start. From there, one up arrow goes to karma start again, or a down arrow goes to cls.

Yes, Mac users, I know that you use a different command to clear your screen, but I don't know it off the top of my head. Usually I run bootcamp on any Mac I use. But the idea is the same.

Not being able to read the text

Like I said, I'm old. I also enjoy sparring in karate, so my glasses may not sit exactly where they're supposed to on my head. So the red karma uses for a failed test is completely illegible to me on the default black background. Karma has about four colors I have seen:

  • Medium gray for ordinary text
  • Green for passing test
  • Red for failing test
  • Teal for console.log

I vaguely think I remember seeing yellow, but I don't remember what they were doing with it.

All this variability means that it can be tough to find a background color that works. Let's not talk text colors, because node and karma change them anyway. In karma, you have the choice of "use colors" or "don't use colors," but there is no "use better colors." Anyway, my experience is that a white background gives the best legibility across the most frequently-used colors. It's a shame, because it seems that "real developers" use darker color schemes, but there you have it.

One problem with setting the background color is that any time you run npm install, node will helpfully change your background color to black. I haven't found any way to get it to stop doing this, but if you set your defaults, you can just close the window and reopen it using the right-click menu described above. To set the defaults, just click the icon in the upper left of the command prompt and select "Defaults."

Future plans

For those wondering why I launch karma over and over rather than just leaving it running, I'm planning an entire post on karma setup in the future.

Deja vu all over again

english mobile

When I started this blog in 2007, I had been developing in a technology called Authorware that Adobe was in the process of killing off. So I decided to concentrate on teaching myself Flex, sharing what I was learning with others who were also making that transition.

I still work in Actionscript a lot, primarily in Flash, but unfortunately I've had to come to the decision that it's not the best use of my time to blog about some of the neat things I'm still doing.

It's not fair to say I'm learning JavaScript, since I've been doing JavaScript in some form for over ten years, but I am learning about the JavaScript ecosystem as I find it in 2014, particularly surrounding AngularJS. I'm shifting focus to once again ramp up in tools that are relevant instead of ones that are becoming less relevant. In the process, hopefully I can help others who are making a similar transition or just who want to learn about the parts of the process that I delve into. I like to think that I'm willing to write about things that others may not feel are glamorous enough to devote time to but that can be incredibly helpful if you're looking for just that information.

I have decided to keep the title of the blog the same. In part this is because I have some loyal readers who have been with me the whole way. In part this is because I think that the AngularJS world will realize in time that the particular experience that former Actionscript developers, especially Flex developers, bring to the table means that we're very well-suited to do things the "Angular way." I hope you enjoy the new direction.

ActionScript, E4X, and White Space

english mobile

I've been reading XML into ActionScript 3 for many years, and I still haven't solved all the issues with it. Given that my searches for solutions to these issues turn up so little, I decided to share the solutions I have found, especially when it comes to white space.

I think at least part of the reason that these problems are so hard to solve is that the XML documentation for many of the properties and methods we need to use is frustratingly circular. So let me start by laying out what some of these do in practice.

ignoreWhiteSpace

I think ignoreWhiteSpace is the property we first try to use to correct some of the issues with E4X. This property will, in fact, fix issues that are caused by having "extra" children that you weren't expecting to be parsing when you use normal formatting, like new lines and tabs, in your XML. However, it then causes other white spaces that might have been pretty important to disappear.

An alternative to using ignoreWhiteSpace is to use xmlVar.elements() instead of xmlVar.children(). This works relatively well unless you need to access something that's not an element, like a comment, or you need to pass the XML to Adobe code (like new DataProvider()) that for some reason is not equipped to handle the vagaries of their own E4X implementation.

prettyPrinting

We're all familiar with the problem where the default XML parsing adds even more formatting than we included in the original XML file, so that

<root>
 <p>The quick brown fox jumped over the
 <b>lazy</b> dog.</p>
</root>
becomes
<root>
 <p>The quick brown fox jumped over the 
  <b>lazy</b> 
 dog.</p>
</root>

I'm sure there are some versions of Flash where setting prettyPrinting to false fixes this problem, but in the version of the Flash player we target, setting this property has no effect. The good news is that TextField, the Flash Label component, and the Flex MX Label component support the condenseWhite property, which gets rid of this issue for text you want to display. I guess if you're using a spark label, the skin will need to use something that supports condenseWhite if you need this.

Wrap in CDATA

One of the reasons XML parsing is so thorny is that we're using the XML to store external content, often HTML-formatted. CDATA does work to preserve HTML formatting, but it has its own issues. One issue is that there's no real documentation about how to get the text out of CDATA.

Funny story--I was once on a Flex project where it turned out I needed to wrap the entire XML package I was building in CDATA. Try though I might, I couldn't find anything that told me how to get at the "stuff" inside the CDATA. With deadline fast approaching, I "hacked" it by giving the text to a Spark label (which did know how to do this), then reading the text out again and casting it to XML.

Some months later, I ultimately discovered that String(myNode) will retrieve the contents of a node, whether its contents are wrapped in CDATA or not. Unless the contents are not wrapped in CDATA but contain HTML formatting anyway. This is something that is quite likely to happen on my team, as the people who produce the XML see no reason they shoulld start wrapping everything in CDATA just because we're using ActionScript 3 now.

In addition, even when things are wrapped in CDATA when they should be, you have to dump your text in one line into CDATA because it faithfully reproduces all those \n's and \t's, and you wind up with a bunch of junk nodes if you have to cast the contents back to XML. This results in XML that isn't readable, and readability is one reason to use XML in the first place.

hasComplexContent

So, if you're getting XML and you know that sometimes certain nodes will contain HTML and sometimes that HTML will be wrapped in CDATA and sometimes it won't, what do you do? One thing you can do is create a function that checks for hasComplexContent and calls toString() if it returns false and children().toXMLString() if it returns true.

This works well, but one issue with it is you have to have access to this function wherever you're parsing XML. And since you can't really extend the XML Class, due to its dependence on static methods and properties, that means you either need to use a static method yourself (not my favorite thing) or you need to violate DRY, unless your application lends itself to only parsing XML nodes in exactly one place.

normalize()

This is probably my favorite method, because it gets rid of all the weird child nodes that contain "\n\t\t". This means that I can now parse formatted XML and not have to allow for weird extra junk in there. More importantly, I can pass that XML to "dumber" code, such as the Flash DataProvider constructor, and it works. It also does not take out the spaces around inline HTML tags, so you can normalize() the XML to make for easy parsing that you should get from ignoreWhiteSpace (but don't, due to the removed spaces), then you can call String(myXMLNode) on the node whether it has complex content or not, and it will work in a TextField with condenseWhite set to true. FTW!

Batch Import Images into Flash Symbols

english mobile

When I find a workflow I like, I sometimes assume that everyone has already discovered that workflow, and I'm late to the party. One of the nice things about participating in user forums is that sometimes that helps me realize that a favorite workflow isn't known to everyone. This is great, because then I have something to blog about!

Today, I want to talk about what is probably one of my all-time best productivity tricks in Flash. In a few minutes, I can:

  1. Import a series of pngs, jpgs, or whatever into my Flash movie
  2. Choose for each image to be wrapped in a symbol or not
  3. Have the symbols and images nicely organized into folders in the library, without any extra effort!
Here's how I do it, starting with a folder of images:

Step 1: Browse the folder in Bridge

First, I right-click on the folder of images and select "Browse in Adobe Bridge"
Once it opens, I select the images I want to use. For this post, I just selected everything in the directory, but Bridge has excellent features for finding just the images I want (that could be a blog post in itself). You can drag them around in Bridge to change the order, if you need to.

Step 2: Load the files into PhotoShop Layers

In the Bridge "Tools" menu, I select PhotoShop>Load Files into PhotoShop Layers.

This launches PhotoShop and does all the work to put the files into PhotoShop layers, in the order they were in in Bridge. Once that has finished running, save the result as a .psd.

Step 3: Create a Symbol in Flash to Import into

Whenever I have to create a new Symbol in Flash, I like to start with a rectangle that's the size I want the MovieClip to wind up, so the registration and transformation points fall in predictable places. So, I create a rectangle the size of my images and convert it to a Symbol (F8).

Step 4: Import the PSD

I usually use the keyboard shortcut to import to stage (Ctrl-R). The import dialogue gives me lots of options. For example, I can select all the images and choose to convert them to MovieClips.
I'll usually convert the images to MovieClips if I want to do timeline animation with them or if I want to apply a base Class to the MovieClip. I can also choose to import each to a different layer or to a different keyframe. Both options are useful, depending on the end result I need.

Once the psd has imported, the timeline looks like this.

Note that the frames will be the reverse order of the order they were in in Bridge. I usually select the frames and reverse the frames (there's a right-click menu for it, but I've set up a keyboard shortcut).

Step 5: Edit the Library Symbols

The MovieClips and Images are nicely organized, but usually there is more I want to do to them.
If I'm applying a Base Class, I might want to rename all the Symbols, for instance, to change ".png" to "_png." I like the Search and Replace extension for this.

Flash also allows you to edit more than one library symbol at a time, by selecting several symbols and clicking the Properties button (sorry, if there is a shortcut for this, I haven't found it).
From this dialogue, you could change all the MovieClips to Graphics, for example, or you could set a Base Class on all the MovieClips at once. Tip: if you set a Base Class, Export for ActionsScript will become checked and the drop-down will have "Yes" selected, and you don't have to touch it.

And that's it, my quick and easy workflow for importing a series of images to Flash.


FlashTips #6: Debug refresh issues in your swf

english mobile

Most of us know that Flash Builder makes it easy to debug a swf on a server by creating a custom debug configuration. Recently, I had a problem where I needed to be able to debug issues that happened when the browser window was refreshed.
Jeffry Houser, the brains behind Flextras.com, apparently had this very same problem, and resolved it by starting a new debugger session that points to about:blank and then connecting that to the swf after the window has been created.
That's a great solution, but the issue I was having was happening pretty much immediately after the window was refreshed--if I went through his steps, I'd "miss the window." So, after limping along for several hours, trying to figure out the problem without having the direct debug information, I finally figured out that the problem was amazingly simple:

  1. Create a new "refresh" debug configuration that doesn't point to a page with a swf in it (I didn't yet know that about:blank was an option).
  2. Start the original debug configuration, that points to the swf as normal.
  3. Get to the problem point in the application.
  4. Launch the "refresh" configuration.
  5. Refresh the window.
  6. Voilà, we are connected, from the very beginning of the bootstrapping process.
Enjoy!

Reusing a Flash Builder Workspace

english mobile

I use Flash Builder and Flash Pro together, and over time I have learned to just bow to how Flash Builder wants me to do things. What this means is that each "family" of Flash files has to have its own Workspace, because Flash Builder expects the Flash file to be in a subdirectory of the workspace in a directory that's the named the same thing as the Flash file. If that's not where it is, you either have to remember to tell Flash Builder not to use its default or things go very wrong, very fast.

In a team environment, the process has to be as simple as possible, without a bunch of fiddly steps that people have to remember to do at exactly the right moment, so it's just easier to go with what Flash Builder wants us to do. However, this adds other fiddly steps that people need to do each time they start a new workspace, such as importing snippets and laying out all the panels just so.

So I thought I'd hit on a brilliant plan, which is just to check the workspace settings into version control that live in the .metadata folder. This way, everyone would get a workspace that's already set up when they export the "base" Flash project and they could just start working. And this does work for the intended purpose, but I found that workspace relative paths would break (paths that refer to the ${DOCUMENTS} variable). These would unaccountably point to the original base project directory.

On Windows, for whatever reason a file contents search didn't turn up the offending string. I suspect this has to do with the weird way the .metadata folder starts folder and file names with "." So I was off to Google to try to find out how other people transfer their settings. I found one post that suggested you just copy the .metadata/plugins/org.eclipse.core.runtime/.settings directory. The result I had from that was that the site relative root now pointed to the project I'd copied the directory from. At least now I had it narrowed down to a large handful of files that I could then open and look at individually.

To save you the bother, I'll tell you that the file that contains the location of the workspace for workspace-relative links in the above directory is called org.eclipse.core.resources.prefs, and that file contains the pathVariable.DOCUMENTS string that tells Flash Builder/Eclipse where the workspace thinks it is. I haven't had a chance to play with it to see if simply not putting that file in version control makes things better or borks them, but even if everyone has to manually update that variable when setting up a project it's much better than having to set up every workspace from scratch when we start a new project.

My favorite Flash Builder Code Templates

english mobile

I hate typing the same code over and over, and DRY can only take you so far. I also hate making the same changes over and over. So I've "tweaked" some of the templates that came with Flash Builder and I've added many to automate the tasks I do frequently. I've made them available for download. You'll need to unzip the file and import the template file into your ActionScript code templates, or you can copy and paste any you find useful.

My version of the fori

I loop through lots of things other than Arrays, and when I do loop through Arrays, I don't like to read the length on every loop. So I've modified the fori template.
for (var ${index}:int = 0; ${index} < ${loopVar}; ${index}++) {
 ${line_selection}${cursor}
}

Looping through MovieClip/Sprite Children

A lot of times, I have a Class where I just know I'll have "some" instances of a specific type, but I don't want to dictate in advance how many that will be. So often I'll have code to find those children. I call this template "childLoop."
var loops:int = numChildren;

for (var i:int = 0; i < loops; i++) {
 var ${varName}:${search_type} = getChildAt(i) as ${search_type};
 if (${varName}) {
  ${cursor}
 }
}

Push into an Array/Vector

Often, inside a child loop, I'm inserting the children that match into a Vector. It's supposed to be faster to use the length property of an Array or Vector to add to it instead of using push(), so when I'm adding to the end of one of these, I use my "fastpush" template.
${arrayOrVector}[${arrayOrVector}.length] = ${newItem};

Sort the Vector

Often, the instances aren't added to the stage in the correct order to match each with the piece of data that goes with it, so I have various sorting functions on hand, such as "leftToRightSort" that can be applied as the sort function to the Vector.
protected function leftToRight(btnA:DisplayObject, btnB:DisplayObject):Number {
 return (btnA.x - btnB.x);
}

If setter value has changed

Flash Builder has a great feature to generate a getter/setter pair from a variable declaration. Even through I'm working in Flash, I often check the box that allows you to dispatch a custom binding event (which doesn't do much in Flash, unless you wire it up yourself). What I do get from that is auto-generated code that checks to see if the variable's value has changed before doing something, such as removing/adding event listeners. Sometimes I forget to check that box or I decide that I don't want the overhead of having the event dispatched and I think that deleting that extra code is more effort than what advantage I get out of using the check box. In those cases, I add essentially the same code with the "ifValueChanged" template.
if(${myVar} != value) {
 ${myVar} = value;
 ${cursor}
}
Do you have favorite code templates? Please share in the comments section.

Excel is Excellent!

english mobile

Lately it seems that, more often than not, I am working with at least two spreadsheets open. Don't tell Steve Howard, but I think I've fallen in love with Excel. It seems to make me orders of magnitude more efficient. Not just for crunching numbers, but a wide variety of tasks.

Planning

I first started using Excel for planning when I was in business for myself. The best way I've ever found is just to break the job down into as many smaller tasks as I can, then estimate each one. Excel makes this a breeze.
Now I'm working in more of a team environment, I find that these spreadsheets are even more useful. Need to print out a list of tasks that need to be discussed at the next meeting? Simply filter on all the tasks that are not complete, but have comments (which is where I put the questions I need answered before I can move forward). Need to write a status report? Copy and paste the completed and planned items into an email.

XML

I admit that I'm almost a big a fan of OxygenXML as I am of Excel, so I rarely use Excel for editing XML. But it's not a cheap program, so if your XML-editing needs are simple, you may find that Excel's XML generation tools do a great job.

Debugging

The company I work for has a culture of including trace statements for "informational" purposes as well as debugging purposes. This is actually pretty nice, but it can make it harder to find debugging statements when you're trying to track down a problem. I find Excel's data filtering feature makes this much easier.

Code Generation

Flash Builder and other IDE's like IntelliJ do a great job of generating code in many circumstances, but there are a lot of things that Excel does much better when you use formulas, especially when the code is based on data that is coming from a spreadsheet anyway. Here are some of my favorite formulas:
Covert the contents of A1 all to Uppercase: = UPPER(A1)
Wrap the contents of A1 in quotes and append q comma (useful when hard-coding Arrays): = """" & A1 & """" & ","